Updating patient resources: how tools to aid personal health tracking can be brought into the digital age
While doing some research into the Depression and Bipolar Support Alliance for one of my patients, I came across their Wellness Tracker.

You can take a closer look at it here.
The Wellness Tracker is a wonderful resource that provides printable PDFs for tracking one's own goals, habits, symptoms, and more. The only potential problem with these resources is that they are meant to be printed out and filled out by hand. Having access to a printer is not necessarily a guarentee for everyone, which may prevent some people from utilizing this helpful tracker.
I began to tinker in React for a way that I may be able to convert the Wellness Tracker into an online application. Their symptom tracker was the most eyecatching, so I started with that.
The Symptom Tracker Application
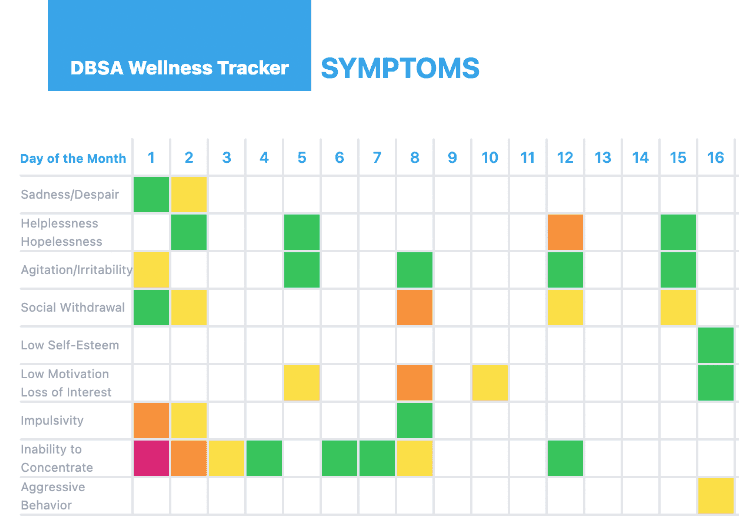
The source material from the DBSA is already laid out so well, it only took minor layout tweaks to create a web application version of their Symptom Tracker. In the original, you are meant to print out the pdf and track your symptoms using a color coded scale.
- Blank - not experiencing the symptom.
- Green - mildly experiencing the symptom
- Yellow - moderately experiencing the symptom
- Orange - strongly experiencing the symptom
- Maroon - Extremely impaired by the symptom
This was one of the things that made me first want to create an application of the Wellness Tracker, because this is truly just screaming to be an interactive webpage.
Instead of coloring in the various boxes, I utilized react component-based architecture to create a Grid container component and fully populate it with GridCell components.
The GridCell component is an extremely simple component. Upon being clicked it will increase symptom intensity for that particular symptom/day to the next level and update it in the state held by the parent component (the Grid). If the symptom is already at maximum intensity it will cycle back to blank.
const GridCell = ({ intensity, updateGrid, day, index }) => {
  const color = [
    '',
    'bg-green-500',
    'bg-yellow-300',
    'bg-orange-400',
    'bg-pink-600',
  ]

  const handleClick = () => {
    // intensity === 4 ? setIntensity(0) : setIntensity(intensity + 1);
    intensity === 4
      ? updateGrid(day, index, 0)
      : updateGrid(day, index, intensity + 1)
  }

  return (
    <div
      className={`h-8 w-8 ${color[intensity]} shrink-0 border`}
      onClick={handleClick}
    ></div>
  )
}
This allows for an entire days worth of symptoms to be filled out in extremely satisfying and intuitive way. After a few moments of inactivity, the data will be stored in the users sessionStorage so that this information will remain even if the webpage is closed or refreshed (assuming the user doesn't delete all their cookies)

Why do this?
One of the reasons that I started to teach myself how to code was to try and improve the lives of patients. I have since expanded this desire to really just try and help anyone who is interacting with health and healthcare, whether they be a patient or provider.
When I first stumbled upon this tracker, I wasn't looking as a nurse, I was looking as a concerned friend. I loved the resources I had found, but I imagined handing a bunch of printed pages to someone I cared about with 4 colored pencils and having them fill out their symptoms at the end of each day -- sort of a tough sell.
But going to a saved webpage, no matter where you are, and clicking through a couple boxes at the end of the day? Well that's a bit easier.
Not only that, now the data is stored electronically, making it extremely easy to share with anyone who is helping you on your medical journey. We can utilize the array of arrays created by filling out the monthly page and run it through backend calculations to find trends in the data that is maybe not immediately clear to the documentor.
Wrapping Up
I do need to mention, I am in no way affiliated with the DBSA. I did not get their approval for creating this application and if I actually published it, I imagine I would need their approval.
It is a personal goal of mine to create an online version of their entire Wellness Tracker and publish it for free. This is just a small piece of all of the amazing resources they offer and to make the journey a bit better for the people that need it most would be incredible.
If you've stumbled upon any other resources similar to this that could benefit from a digital upgrade, shoot me an email! I would love to hear about it.
Until next time,
Ian K